VibeChart: Build Professional Charts from Words in Seconds
VibeChart is an application that creates custom charts and diagrams directly from text and data files. This software turns raw information into clear visual representations using simple, typed commands.
This ai chart generator is useful for professionals who need to produce data visualizations quickly without learning complex business intelligence (BI) software. It is built for a wide range of fields, including data analytics, consulting, and product management.
The main function of this tool is to make ai data visualization available to users who lack technical skills in data handling or coding. It offers an alternative to the time-consuming, manual process of cleaning data and building charts in spreadsheet programs like Excel. This approach results in a faster, conversational, and more direct workflow, allowing users to focus on interpreting data rather than on the mechanics of creating visuals.
Best Use Cases for VibeChart
- Data Analysts & Researchers: For analysts performing quick exploratory data analysis, VibeChart removes the need to write scripts or configure complex BI dashboards. It can take raw survey data and instantly produce a bar chart of responses or a scatter plot to identify correlations, speeding up the research phase for anyone who needs to create charts with ai.
- Business Consultants: Consultants can use this platform to produce visuals for client presentations. During a meeting, they can take notes and use the tool to generate a flow diagram from that text, providing instant clarity and supporting their recommendations with data-backed visuals.
- Product Managers: Product managers track key performance indicators (KPIs) from multiple sources. The tool allows them to upload a weekly user engagement CSV file and ask for a line chart showing daily active users or a funnel chart illustrating user conversion rates, saving time on routine reporting.
- Marketing Professionals: Marketers can use this ai chart generator from text to translate campaign performance data into digestible reports. A marketing manager can paste data from an analytics platform and ask, “Create a pie chart of our traffic sources,” turning rows of numbers into a clear visual story.
Our Expert Rating
Pricing
Starts at: $20/month
Model: Pay per Month
Direct Text-to-Chart Interface: The tool's greatest strength is its ability to convert simple text prompts into accurate visuals, making it usable by anyone.
Fast Generation Speed: The tool creates charts in seconds, a significant improvement over the time it can take to build them manually.
Built-in Data Cleaning: The platform includes an AI function that can automatically parse, clean, and format messy, unstructured data, handling a critical preparation step.
Wide Variety of Charts: With support for over 40 different chart and diagram types, the tool offers flexibility for diverse ai data visualization needs.
Flexible Data Import Options: Users can provide data by uploading CSV, PDF, and Excel files, or by copy-pasting from another source.
Accessible Freemium Plan: The free tier includes 10 charts, allowing users to test the core functions before committing to a paid plan.
Developer-Friendly API: For advanced cases, VibeChart offers API access to integrate its chart generation into other applications.
Limited Public History: As a newer tool, it lacks extensive user reviews and case studies that demonstrate long-term reliability.
No Direct App Integrations: While charts can be embedded, the tool lacks a marketplace of one-click integrations with popular apps like Slack or Notion.
Unclear Company Background: Information about the development team and company history is not available, which can be a point of consideration.
Potential for AI Misinterpretation: The natural language processing can sometimes misunderstand nuanced prompts, requiring the user to rephrase their request for this ai chart generator.
-
Natural Language Chart Generation: This core feature allows users to type commands in plain English, such as “create a bar chart of sales by region,” to produce visuals.
-
AI Data Engineer: The tool automatically cleans and prepares raw data inputs, handling inconsistencies and formatting issues without user intervention.
-
Multi-Source Data Import: VibeChart supports the direct upload of common file formats, including CSV, Excel, and PDF.
-
Image Data Extraction: A useful feature is the ability to extract tabular data from an uploaded image and convert it into a chart.
-
Pasted Data Support: Users can copy data from any source and paste it directly into the tool for analysis.
-
40+ Chart & Diagram Types: The platform’s library includes common graphs like bar, line, and pie charts for various business and research needs.
-
Custom Image Export: Charts can be exported as high-quality images with custom dimensions for presentations and reports.
-
Embeddable Charts: VibeChart generates HTML code snippets to embed interactive charts in external platforms or internal dashboards.
-
API Access: The Enterprise plan provides a REST API for developers to programmatically create charts with ai at a larger scale.
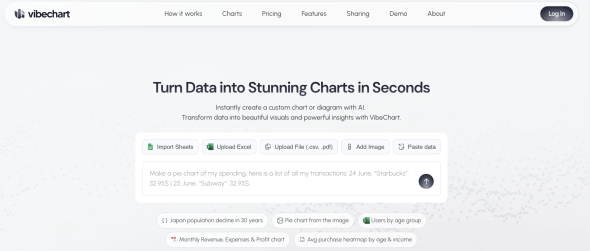 VibeChart Homepage
 AI Chart Generator
Frequently Asked Questions
-
What is VibeChart?
VibeChart is a software tool that uses AI to create charts and diagrams from text prompts and data files. -
Can AI do data visualization?
Yes, artificial intelligence can perform data visualization. AI tools like VibeChart interpret text commands to automatically generate charts, graphs, and diagrams from raw data, which simplifies the creation process. -
How does the AI in VibeChart work?
The AI in VibeChart uses natural language processing to understand a user’s typed request. It then analyzes the provided data, cleans it if necessary, and selects the appropriate visual format to build the chart. -
What types of files can I use with VibeChart?
The tool accepts several common file formats, including CSV, Excel (XLSX), and PDF files. Users can also paste data directly into the application or upload an image containing a data table. -
Is VibeChart free to use?
Yes, the platform offers a free plan that includes the creation of up to 10 charts. For unlimited charts and more advanced features, it provides paid subscription plans.
Tech Pilot’s Verdict on VibeChart
I spent time exploring VibeChart to understand its role among AI-driven data tools. My goal was to see if its promise of conversational chart creation holds up and whether its simplicity affects its capability.
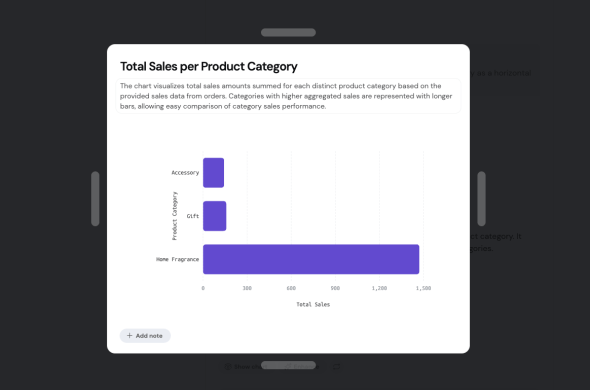
First, I tested its data handling with a messy sales data table I copied from a webpage. I pasted it into the platform and typed the prompt: “Show me the total sales per product category as a horizontal bar chart.” In under a minute, the tool correctly parsed the data and generated a clean, accurate chart. This test confirmed its built-in data preparation function is effective.
Next, I used a CSV of customer survey data with a more complex request: “Visualize the correlation between customer satisfaction scores and renewal rates, but segment the data by company size.” The initial chart was a simple scatter plot that missed the segmentation. After I refined the prompt to be more explicit—”Create a scatter plot of satisfaction vs. renewal, and use different colors for each company size tier”—it worked correctly. This shows that while the ai data visualization is capable, users may need to learn how to phrase requests for multi-layered queries.
From a value perspective, the tool pricing is fair. The free plan is sufficient for users with occasional needs, and the Pro plan is competitive. The learning curve is minimal; if you can write a sentence, you can use this ai chart generator from text.
Top Alternatives to Vibechart
-
Datastripes: Datastripes is a more extensive AI data analysis platform targeting data scientists and engineers. It offers entire analysis workflows, not just chart generation. While VibeChart is ideal for quick visualizations, Datastripes is a better choice for deep, multi-step data exploration.
-
ChartAI: ChartAI is a close competitor to VibeChart, focusing on the same text-to-diagram function. Its feature set is comparable, making it a direct alternative. The best choice between them may depend on specific chart types offered, user interface, and price.
-
Graphy: Graphy’s strength is its direct integrations. It is built to embed and sync charts with tools like Google Sheets and Notion. If your primary need is to share updating charts within your existing productivity software, Graphy is likely the superior option over VibeChart.
Final Verdict
In summary, VibeChart is a focused tool that delivers on its core function: making data visualization as direct as asking a question. It is a fast and user-friendly utility for anyone needing to turn data into a clear visual story. For professionals, consultants, and students who want to create charts with ai without the friction of traditional software, this AI is a worthy tool to try.