Claude Dashboards and Motion: Beta Explained
 Eimantas Kazėnas Marketing & Tech
 - Published
- 8 min read
On this page What is Claude Dashboards?
Independent and reader-supported. Some links may earn us a commission; it never changes our rankings. Editorial policy
Claude Dashboards turns plain-language questions into live charts from your company data, and Claude Motion turns reports into short animated explainers.
Anthropic launched both as betas on October 8, 2026. They are not separate apps. Each one is a new artifact template inside the normal Claude chat, so you ask for a dashboard or an animation the same way you ask for a doc. The catch is access: the two features sit on different plans, and Enterprise admins have to switch them on first.
The short version:
- Claude Dashboards: connects to a data warehouse (BigQuery, Snowflake, Databricks, Redshift, ClickHouse) or apps like Salesforce, writes the SQL for each chart and keeps the dashboard refreshed. Beta on Pro, Max, Team and Enterprise.
- Claude Motion: builds a short animation from your text, charts and images as editable code, then exports an MP4. No AI video model, no generated people. Beta on Team and Enterprise only.
- Cost: no add-on fee. Both count toward your plan’s normal usage limits. Pro starts at $17 a month billed yearly ($20 monthly).
- Not on Free: the Free plan gets Docs, Slides and Design, but neither of these two betas.
What is Claude Dashboards?
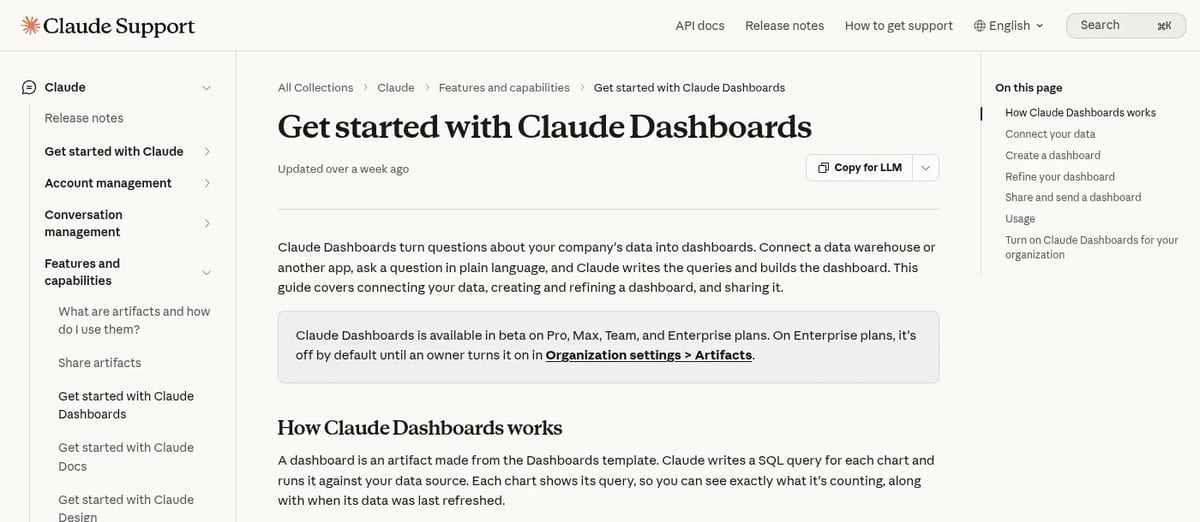
Claude Dashboards is Claude’s way of answering “can someone pull the numbers on this?” without a ticket to the data team. You connect a data source, ask a question in plain English, and Claude writes one SQL query per chart, runs it against your data and lays the results out as a dashboard. According to the help center guide, a dashboard is an artifact made from the Dashboards template, and every one you build is saved in the Artifacts tab.
Three details matter more than the marketing line:
- You can see the query. Click any number and Claude shows the SQL behind it, or explains it in words. If it counted the wrong thing, you tell it what to change.
- It stays current. Each chart shows when its data was last refreshed, and the dashboard updates as the underlying data changes. Anthropic has not published a refresh interval.
- It hands off to real BI tools. When a question needs deeper work, you can send the dashboard to Amplitude, Grafana, Hex, Mixpanel, Omni, Perplexity, PostHog or Sigma. Databricks Genie, Looker, monday.com and Tableau are listed as coming soon.
Supported sources at launch: Amazon Redshift, BigQuery, ClickHouse, Databricks and Snowflake as warehouses, plus any app you have already connected to Claude, such as Salesforce. Anthropic positions it for quick, exploratory questions, like how this week’s signups compare with last month’s, not as a replacement for your BI stack.
What is Claude Motion?
Claude Motion makes short animated explainers: a 30-second summary of a quarterly report for an all-hands, a chart that builds itself in a board deck, or a product walkthrough for onboarding. The result plays like a video, but it isn’t generated footage.
That is the key difference from AI video generators. Claude writes code that animates your own text, charts, shapes and images. Anthropic says Motion “doesn’t use a video generation model”, so there are no realistic scenes and no AI-generated people. Because it is code, you can change one word, number or timing and the rest stays put, either in the editor or by asking Claude (“change the Q3 number to 18%”).
- Export: click Export and choose MP4.
- Take it further: open the animation in Adobe, Descript, HeyGen, Higgsfield, invideo, Luma AI or Runway. Canva and Captions are coming soon.
- Sharing: animations start private; Share sends a link, including outside your organization if your admin allows it.
If you actually need generated footage, people or scenes, Motion is the wrong tool. Look at a text-to-video generator instead; we compared the free ones in our free AI text-to-video guide. Motion is for explaining your own numbers, and you can finish it in an editor like Descript.
Who gets access, and what it costs
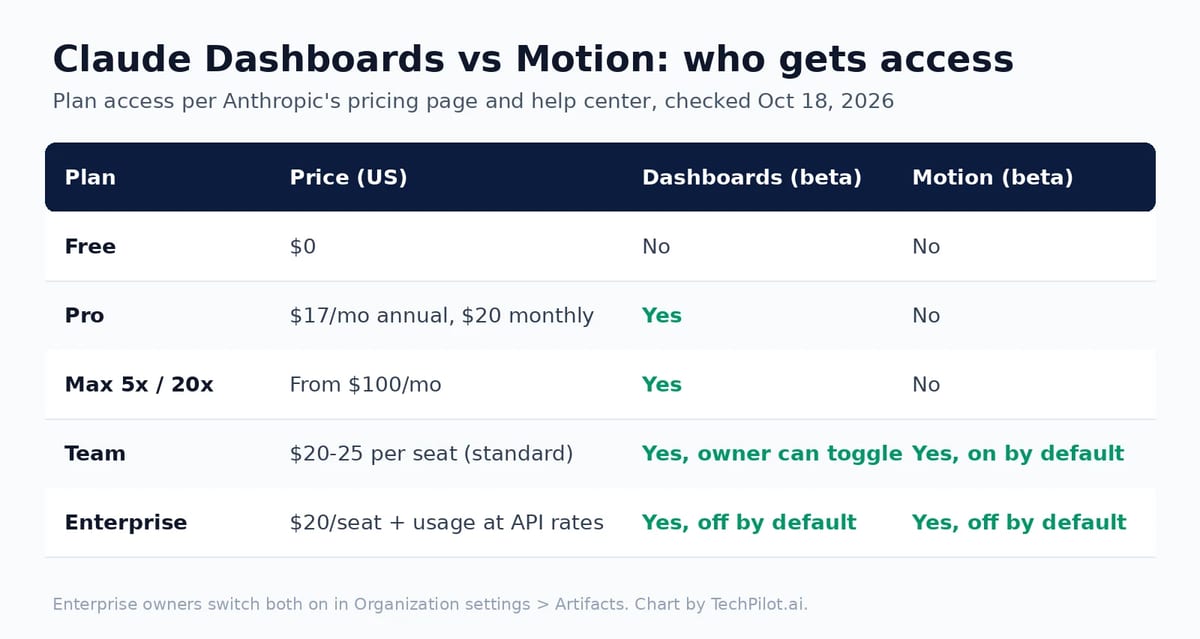
This is where most people get stuck, because the two betas don’t share a plan list. We checked Anthropic’s pricing page and both help center guides on October 18, 2026:
| Plan | Price (US) | Dashboards | Motion |
|---|---|---|---|
| Free | $0 | No | No |
| Pro | $17/month billed yearly ($200 up front) or $20 monthly | Yes (beta) | No |
| Max 5x / 20x | From $100/month | Yes (beta) | No |
| Team | Standard seat $20/seat/month yearly or $25 monthly; Premium seat $100 or $125 | Yes (beta) | Yes (beta), on by default |
| Enterprise | $20/seat/month billed yearly, 20-seat minimum, plus usage at API rates | Yes (beta), off by default | Yes (beta), off by default |
There is no separate charge for either feature. Both count toward your plan’s usage limits, and the Motion guide warns that longer or more complex animations use more of your limit than a typical message. So the real cost question is whether your plan’s limit can absorb the work, not a per-dashboard fee.
Our read on pricing: a solo analyst who wants Dashboards can start on Pro. If you want Motion, you need at least two people on Team, because Team is sold for teams of 2 to 150. There is no way to get Motion on an individual plan today.
How to use Claude Dashboards
- Connect your data. Add a warehouse connector (Redshift, BigQuery, ClickHouse, Databricks or Snowflake) or use an app you’ve already connected, like Salesforce.
- Ask in any chat. For example: “Show weekly signups for the last six months, split by plan.” You can also pick Output in the message box and choose Dashboards, or open the Artifacts tab and select a Dashboards template.
- Ask a question, not for a chart. Anthropic’s own tip: “How do this month’s signups by channel compare with last month’s?” works better than “a signups chart”. Name the table or app if you know it.
- Check the query. Open a chart’s SQL before you trust the number. This is the step that catches a wrong join or a missing filter.
- Refine and share. Ask for changes (“add a filter for region”, “make this weekly”), then click Share. Dashboards start private to you.
How to use Claude Motion
- Attach your content. Upload the report, data or images you want animated so Claude builds from your material.
- Describe the audience, place and length. For example: “Turn this quarterly report into a 30-second explainer for our all-hands.” Or choose Output, then Motion, or a Motion template in the Artifacts tab.
- Edit. Ask for changes (“slow down the second scene”) or adjust it yourself in the editor.
- Export. Click Export, choose MP4, or open it in one of the partner video tools.
For admins: turning them on
Owners and Primary Owners control both features in Organization settings > Artifacts.
- Team: Motion is on by default. Owners can turn Dashboards and Motion on or off.
- Enterprise: both are off by default. Owners can switch them on and limit them to specific groups with custom roles.
Before you switch Dashboards on, decide which warehouse credentials Claude should use. Since it runs real queries against your data, a read-only role scoped to the tables people should see is the sensible default. That’s our recommendation, not an Anthropic requirement.
Limits and what isn’t documented yet
- Beta status: both are labelled beta, so expect changes.
- No published caps: Anthropic hasn’t published a maximum animation length, a dashboard refresh schedule or a query limit. The only stated limit is your plan’s overall usage.
- Not a BI replacement: Anthropic itself frames Dashboards as a starting point for exploratory questions, with handoff to tools like Hex or Sigma for deeper analysis.
- No footage: Motion can’t create realistic video or people by design.
The same launch also took Claude Docs, Slides and Design out of beta on every plan, including Free. If you used the standalone Claude Design site, it moves into Claude and stays at claude.ai/design only until December 14, 2026.
Is it worth it?
For teams that already pay for Claude, yes, try both. Dashboards removes the slowest part of a simple data question, waiting for someone to write SQL, and showing the query keeps it honest. The risk is people trusting a chart they didn’t check, so make “open the query” a habit.
Motion is narrower. It’s a good fit for internal explainers and animated charts where accuracy matters more than visual flair, and a poor fit for marketing videos that need real footage. If you’re still choosing between assistants, our best AI model guide compares Claude with GPT and Gemini.
Frequently asked questions
What is Claude Dashboards?
A beta feature in Claude that connects to a data warehouse such as BigQuery, Snowflake, Databricks, Redshift or ClickHouse, or apps like Salesforce, and turns plain-language questions into dashboards. Claude writes a SQL query for each chart, shows it to you and keeps the data refreshed.
What is Claude Motion?
A beta feature that turns your reports, charts and images into short animated explainers. Claude writes the animation as code, so you can edit any word, number or timing, then export an MP4. It does not use a video generation model.
Is Claude Dashboards free?
No. It is not on the Free plan. It is in beta on Pro, Max, Team and Enterprise and has no separate fee; it counts toward your plan’s usage limits. Pro costs $17 a month billed yearly or $20 monthly.
Can I get Claude Motion on Pro or Max?
Not right now. Anthropic lists Claude Motion in beta on Team and Enterprise plans only. On Team it is on by default; on Enterprise an owner has to turn it on.
How do I turn on Dashboards and Motion for my company?
Owners and Primary Owners go to Organization settings, then Artifacts. On Enterprise both features are off by default and can be limited to specific groups with custom roles.
Can Claude Motion make realistic videos or AI people?
No. Motion animates your own text, charts, shapes and images. Anthropic says it creates no generated footage and no AI-generated people. You can open the animation in tools like Runway, HeyGen or Descript to add more.
Found this useful? Share it with someone comparing AI tools.
Figma Code Layers Explained (+ Figma Specs)
Figma code layers put running code on the canvas, in open beta since Oct 15. What they do, how to make one, which plans get them, credits, and Figma…
 Mihai (Mike) Bizz · 6 min read
Ultramarine 1 Flash vs Claude
Ultramarine 1 Flash vs Claude: Paper Instruments lists $0.15/$0.50 API vs Claude Fable 5 at $10/$50. Vendor JobBench claims labeled; who should try…
 Eimantas Kazėnas · 4 min read